§ 5.1 Module 5 — The Hydraulic Profile
What a Profile Is For
A drawing that states no flow is not a profile. It is a picture of one, and there is nothing in it to check.
By the end of this lesson
- State the three failure modes a profile is meant to expose
- List the flow and level conditions a complete set of profiles covers
- Explain why the worst case is not always maximum flow
5.1.1The questions only a profile answers
The four modules behind this one each argued about a quantity: head is energy per weight of fluid, friction takes some of it, fittings take more. A hydraulic profile is the first artefact in the course that is not an argument. It is a claim — at a stated flow and a stated water level — about where the energy in the water stands at every point along its path; and because pipe and water are plotted on the same two axes, that claim can be checked one station at a time by somebody who does not trust you.
§1.5 read a profile that already existed; this module draws one, and drawing is an assertion you sign. So begin with what the assertion is for. A hydraulic profile answers five questions, and it is worth being exact about them: a drawing that answers four is not 80% of a profile but an unfinished one.
- At the stated flow, does the water arrive? The grade line must reach the far end at or above the water surface it discharges into, with whatever residual pressure that system requires.
- Does the station stay out of the sewer that feeds it? The wet well surface must sit below the arriving invert at the worst level condition, or the station is backing water up the pipe it was built to relieve.
- Is the main full and above atmospheric pressure at every local maximum? Local high points are where separated or entrained gas can accumulate, so each needs an explicit pressure and air-management check.
- What head range must the pump supply? A range, not a number: static lift moves with the wet well level, friction with flow and with the age of the pipe. That range is what the profile hands to Module 6.
- Where is the lowest pressure, and what margin has it? That point governs cavitation at the pump and column separation on the main.
No plan can answer any of those, and only the second can be argued from a section (§1.5). The profile is the only drawing in the set on which a hydraulic error becomes a visible geometric fact — a dashed line passing below a solid one — which is why it is the sheet a reviewer attacks first and hardest.
Rome, AD 97: the first audit of a water system
Sextus Julius Frontinus was appointed curator aquarum — water commissioner of the city of Rome — under the emperor Nerva in AD 97, and wrote De aquaeductu urbis Romae, which survives. It is not a design manual. It is a review.
Frontinus did the one thing that makes a water system checkable: he compared the quantity measured into each aqueduct at its source with the quantity recorded as delivered at the far end, and found the second far smaller. He blamed unauthorised taps and the collusion of the men who maintained the pipes. His remedy was a drawing-office one: the delivery nozzles — the calices — were to be bronze, made to fixed sizes and stamped, so that the size of a tap became a recorded fact rather than a matter of opinion.
A hydraulic profile makes the same move. Nothing about the water changed when Frontinus stamped the calices; what changed was that a claim about it acquired a form in which somebody else could find it false.
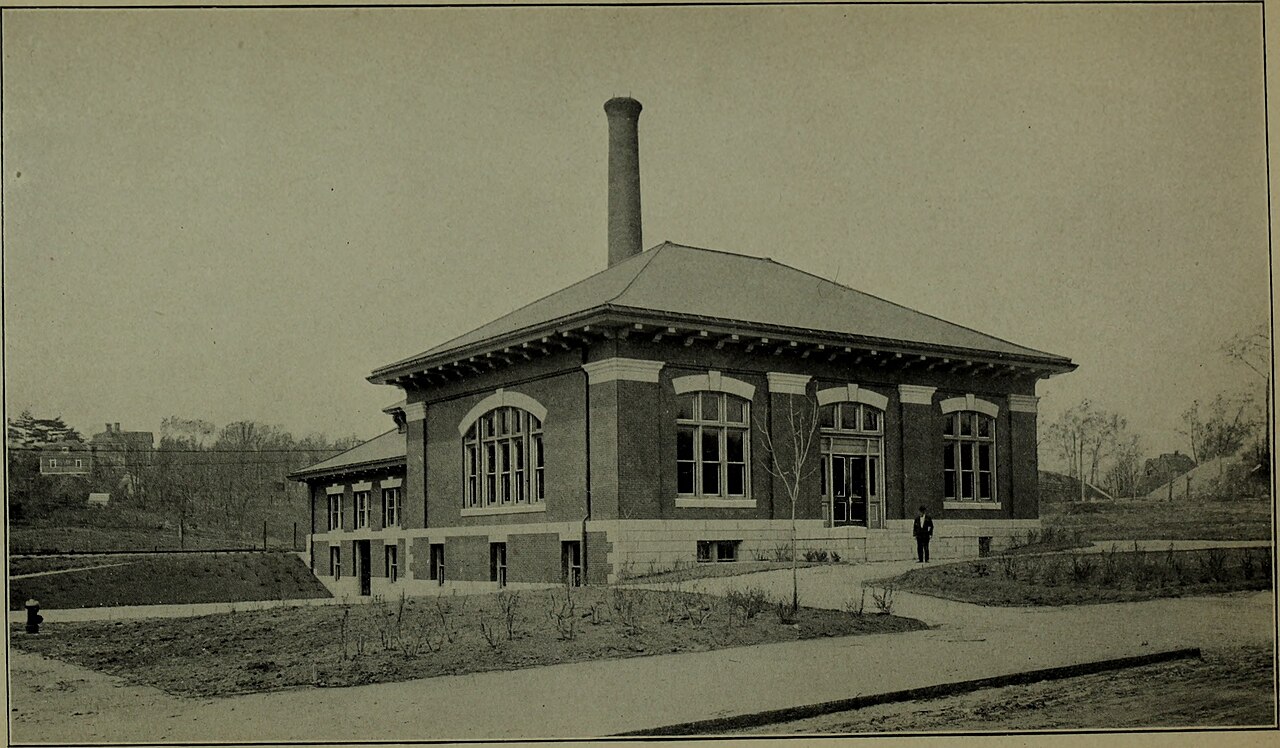
A utility report preserved the pumping station as review evidence. Modern profiles add explicit HGL and EGL, but the obligation to document the built hydraulic path is older.
Massachusetts. Metropolitan Water and Sewerage BoardNo restrictionsWikimedia Commons
5.1.2A profile is a claim about exactly one condition
Here is the station this module builds. Wet well floor at 3.60 m, top slab at grade, 12.00 m; a 375 mm concrete sewer arriving on a 0.30% grade with its invert at 6.40 m; pumps off at 4.80 m, lead pump on at 5.80 m, alarm at 6.20 m. From the well a 300 mm cement-lined ductile iron force main runs 1 850 m under 1.20 m of cover to a receiving manhole whose water surface stands at 28.60 m. The ground rises 17.60 m over that length, unevenly: a summit at 1+050 at 32.00 m, a swale behind it, and a second, lower high point at 1+480.
Now assert a condition — one pump at 78 L/s, the well at its lead-on level of 5.80 m, the pipe assumed as-built at 0.10 mm roughness — and the profile follows without further choices. The velocity is 1.10 m/s. Darcy-Weisbach through Colebrook (§3.2) prices the main at 0.357 m per 100 m, so 6.60 m over its length, and the station's own pipework and fittings add 0.49 m (Module 4). The head demanded is the static lift of 28.60 − 5.80 = 22.80 m plus those losses: 29.89 m.
The grade line is drawn from the far end backwards, which is the most useful habit in this module. The receiving water surface at 28.60 m is the only elevation on the sheet the hydraulics does not choose — it belongs to somebody else's structure. The main discharges submerged, so the whole velocity head is lost at the outlet and the grade line just inside the pipe is 28.60 m. Every metre upstream stands higher by the friction still to be spent getting there, which puts the line at 35.20 m where it leaves the pump. The far end is pinned; the pump end floats.
Two notes before the instrument below lets you move it. The energy grade line is not drawn: at this flow it sits 0.062 m above the hydraulic grade line, and at a vertical scale of about 1:300 that plots as 0.21 mm, thinner than the line itself — hence the schedule of losses that accompanies every profile, and why reviewing only the picture is reviewing half the drawing. And the sheet is drawn at a vertical exaggeration of 10:1 and says so: the steepest surveyed reach climbs 7.20 m in 270 m, a true grade of 2.667%, which reads as 1.53° at 1:1 and as 14.93° here.
Interactive 3D instrument
One sheet, one condition — and the four things a reviewer does with it
A 3D instrument you drive yourself, one variable at a time. It needs JavaScript and WebGL, so it is not shown in this static copy of the page.
Vertical exaggeration helps reveal grade changes but can visually overstate pressure slopes and clearances. A viewer may read geometry from a diagram that was intended only to show energy.
State both scales and put decisive elevations and pressures in text, not only in the drawn gap between lines.
5.1.3What a reviewer checks, in the order they check it
Design review is not redesign, and a reviewer has no interest in your judgement — only in the ways this drawing can be silent, inconsistent or false, cheapest checks first, because the cheap ones invalidate the expensive ones. Each item exists because a station somewhere failed without it.
- Is the datum named — here and on every other sheet? Elevations are differences from an agreed surface (§5.2); two datums in one set produce a plausible drawing and an inadequate pump.
- Is the vertical exaggeration stated? 10:1 here; without it no slope on the sheet can be read.
- Is the flow stated as a number, with the level condition beside it? 78 L/s at a wet well surface of 5.80 m. A grade line without both is evidence of nothing.
- What is the grade line pinned to at the far end? 28.60 m, the receiving manhole's water surface — itself a referenced elevation off a survey or a record drawing. If that end is assumed, every clearance on the line is fiction.
- Is the wet well surface below the arriving invert? The invert is 6.40 m and lead-on leaves 0.60 m. At this station's firm-capacity condition — peak inflow with the lag pump out of service — the level reaches 6.70 m and the margin is −0.30 m: a finding, and invisible on the sheet the designer submitted.
- At every local maximum, is the grade line above the crown — at the LOWEST flow, not the highest? At 1+480 the crown is 29.70 m and the grade line at 78 L/s is 29.92 m: +0.22 m, a pass by 220 mm. With the pumps off the line is flat at 28.60 m and that crown stands 1.10 m above it. Check every local maximum, not the tallest: 1+480 governs at 78 L/s, the taller 1+050 governs at low flow, and they change hands near 65 L/s.
- Is the velocity acceptable at the pumping rate? 1.10 m/s here. Common practice for a sanitary force main is a minimum near 0.6 m/s (2 ft/s) — 42.4 L/s in this 300 mm pipe — with about 1.05 m/s (3.5 ft/s) daily to scour, 74.2 L/s here. Those numbers belong to the governing standard, not to physics.
- Does the loss schedule add up to the drop the grade line shows, and does it name its method and its assumed pipe condition? Darcy-Weisbach gives 6.60 m over the main; Hazen-Williams gives 6.54 m at C = 140 and 8.70 m at C = 120 for the same pipe aged. The methods agree to about 1%; the assumed condition moves the answer by a third.
- What head range does the sheet promise the pump, and does every condition fit inside it? The profile's output — and the check the next section fails.
station                              1+480
ground, surveyed                     30.90 m
cover, specified                     -1.20
                                    ------
crown of the force main              29.70 m

receiving water surface, referenced  28.60 m
friction below this point            +1.32     370 m at 0.357 m/100 m
                                    ------
hydraulic grade line at 1+480        29.92 m

grade line minus crown               +0.22 m   PASSES, by 220 mm
same check with the pumps off        -1.10 m   FAILS
absolute pressure head, pumps off     8.99 m above vapour pressure
The high-point check at 1+480, written the way it should appear on a sheet: every line either surveyed, specified, or computed from the two above it. Friction slope from headLossDarcy() at 78 L/s; the arithmetic closes to the millimetre.
A negative clearance is a finding, not a verdict
Two different things live in a grade line drawn below the crown. A sealed water column can remain full under sub-atmospheric pressure, but dissolved or entrained gas may accumulate at a high point, and air can enter through a vacuum function or inward leak. The result can be a pocket that loses bore and capacity and eventually delivers a slug to a valve — hence air valves (§5.4). Column separation is a much higher bar: the absolute pressure must fall to vapour pressure. At this site — 60 m above sea level, water at 15 °C — the barometric head net of vapour pressure is 10.09 m, so the summit at 1+050 with the pumps off sits at 2.20 m of vacuum and still holds 7.89 m above vaporising. The comment is "air valve required and not shown", not "the main will collapse".5.1.4Why one profile is never enough
A profile proves one condition, and a station does not run in one condition. The three variables are independent: how much is pumped, where the water level sits, what the pipe is assumed to be like. Sweep them and you get a condition set, which is what a submission actually is. Here are eight for this station, all legitimate, all off the same survey.
| # | Condition | Q, L/s | Well WS, m | Pipe | Head demanded, m | Grade line over crown, m | Fails |
|---|---|---|---|---|---|---|---|
| 1 | pumps off, well at lead-on | 0 | 5.80 | as built | 22.80 | −2.20 at 1+050 | high point |
| 2 | one pump, high water | 78 | 6.20 | as built | 29.49 | +0.22 at 1+480 | — |
| 3 | one pump, low water | 78 | 4.80 | as built | 30.89 | +0.22 at 1+480 | — |
| 4 | two pumps, low water | 112 | 4.80 | as built | 38.02 | +1.54 at 1+480 | — |
| 5 | one pump, low water, year 30 | 78 | 4.80 | year 30 | 33.13 | +0.66 at 1+480 | — |
| 6 | two pumps, low water, year 30 | 112 | 4.80 | year 30 | 42.87 | +2.50 at 1+480 | head claim |
| 7 | two pumps, high water, year 30 | 112 | 6.20 | year 30 | 41.47 | +2.50 at 1+480 | head claim |
| 8 | peak inflow, one pump, well surcharged | 78 | 6.70 | year 30 | 31.23 | +0.66 at 1+480 | surcharge |
Four of the eight fail a check, and no two fail the same one. The drawing the designer submitted — row 3 — passes all four. That is not dishonesty; it is what happens when a set of one is chosen by the person whose design it is. This sheet promises a head range of 29.0 to 38.5 m, exactly what its own as-built profiles produce, and the year-30 two-pump corners demand 42.87 m and 41.47 m.
The most useful thing in the table is the pair of columns that move in opposite directions. Age the main from 0.10 mm to a year-thirty forecast of 0.50 mm (§3.5) and hold everything else still. The head demanded rises from 29.89 m to 32.13 m, which is bad. The clearance at 1+480 rises from +0.22 m to +0.66 m, which is good: the grade line is pinned at the discharge, so friction below a high point lifts the line above it. One variable, two checks, opposite signs — and no intuition of the form "aging makes everything worse" survives it.
What the set delivers is not a drawing but an envelope: this station demands between 22.80 m and 42.87 m of head, a span of 20.07 m, and 29.89 m at the condition it will spend most of its life in. That envelope is what the profile hands to §6.2, where a pump curve gets read, and to §7.2, where curve and system decide the flow between them. Until then the pump stays a black box supplying whatever head the drawing demands — exactly the assumption a profile is entitled to make.
Lab 5.1
The reviewer's arithmetic: build a grade line and find what governs
Four small functions. Together they are the whole high-point check, and they are the functions you will reach for every time somebody hands you a profile. No friction correlation is needed — the friction slope is given, because on a constant-diameter main it is constant, and this exercise is about the bookkeeping that surrounds it. hglAt(stationM, sheet) — return the hydraulic grade line elevation in metres at stationM , given sheet = { lengthM, dischargeWaterM, frictionSlopePerM } . The line is pinned at the far end: at stationM === lengthM it is dischargeWaterM , and every metre upstream stands higher by the friction still to be spent getting there. clearanceAt(highPoint, sheet) — return grade line minus crown in metres, where highPoint = { stationM, crownM } . Positive means the pipe is above atmospheric pressure there; negative means air will collect. governing(highPoints, sheet) — given an array of high points, return { stationM, clearanceM } for the one with the least clearance. That is the high point that governs, and it is not always the tallest. worstCondition(conditions, highPoints) — each condition is a sheet with a name: { name, lengthM, dischargeWaterM, frictionSlopePerM } . Return the name of the condition whose governing clearance is smallest. SHEET and HIGH_POINTS are already defined for you — the worked station from §5.1.2, whose friction slope of 0.0035693 m/m at 78 L/s comes from headLossDarcy . Graded in the browser against 8 assertions; the editor and harness require JavaScript.
5.1.5What this sheet does not yet contain
Five things above were used and not earned. The datum under every elevation, and the stationing along the bottom, are §5.2. The 0.49 m of station losses was quoted as a lump; accumulating it in order from the incoming invert to the discharge flange is §5.3. What to do about a high point once you have found one — air valves, sub-atmospheric reaches, why a rolling profile is worse than a steady climb — is §5.4. The conventions that let a reviewer recheck every number without phoning you are §5.5. The slug of air arriving at a closing valve is §8.5.
Take one habit from this lesson: before drawing anything, write down the condition set — the flows you intend to run, the level conditions each can occur at, and the pipe conditions you will defend for the design life. That list is the specification for the drawings, and it is also, word for word, the list a reviewer will ask you for.
Check your understanding
Check your understanding
3 auto-graded questions with an explanation for every wrong answer. Requires JavaScript. (m5-l1-q1)
Every number in this lesson belongs to one worked station and comes from the model in src/scenes/m5/profile-purpose.js, whose sixteen verifiers check it against closed forms, hand arithmetic, Hazen-Williams, the published 10.33 m of water per atmosphere, and a sweep requiring every reviewer check to be reachable in both the passing and the failing state.